Manufacturing Monitoring
OEE Welding Single Product
Real-time OEE monitoring workflow for welding performance, downtime visibility, and machine-level analytics.
Workflow Illustration
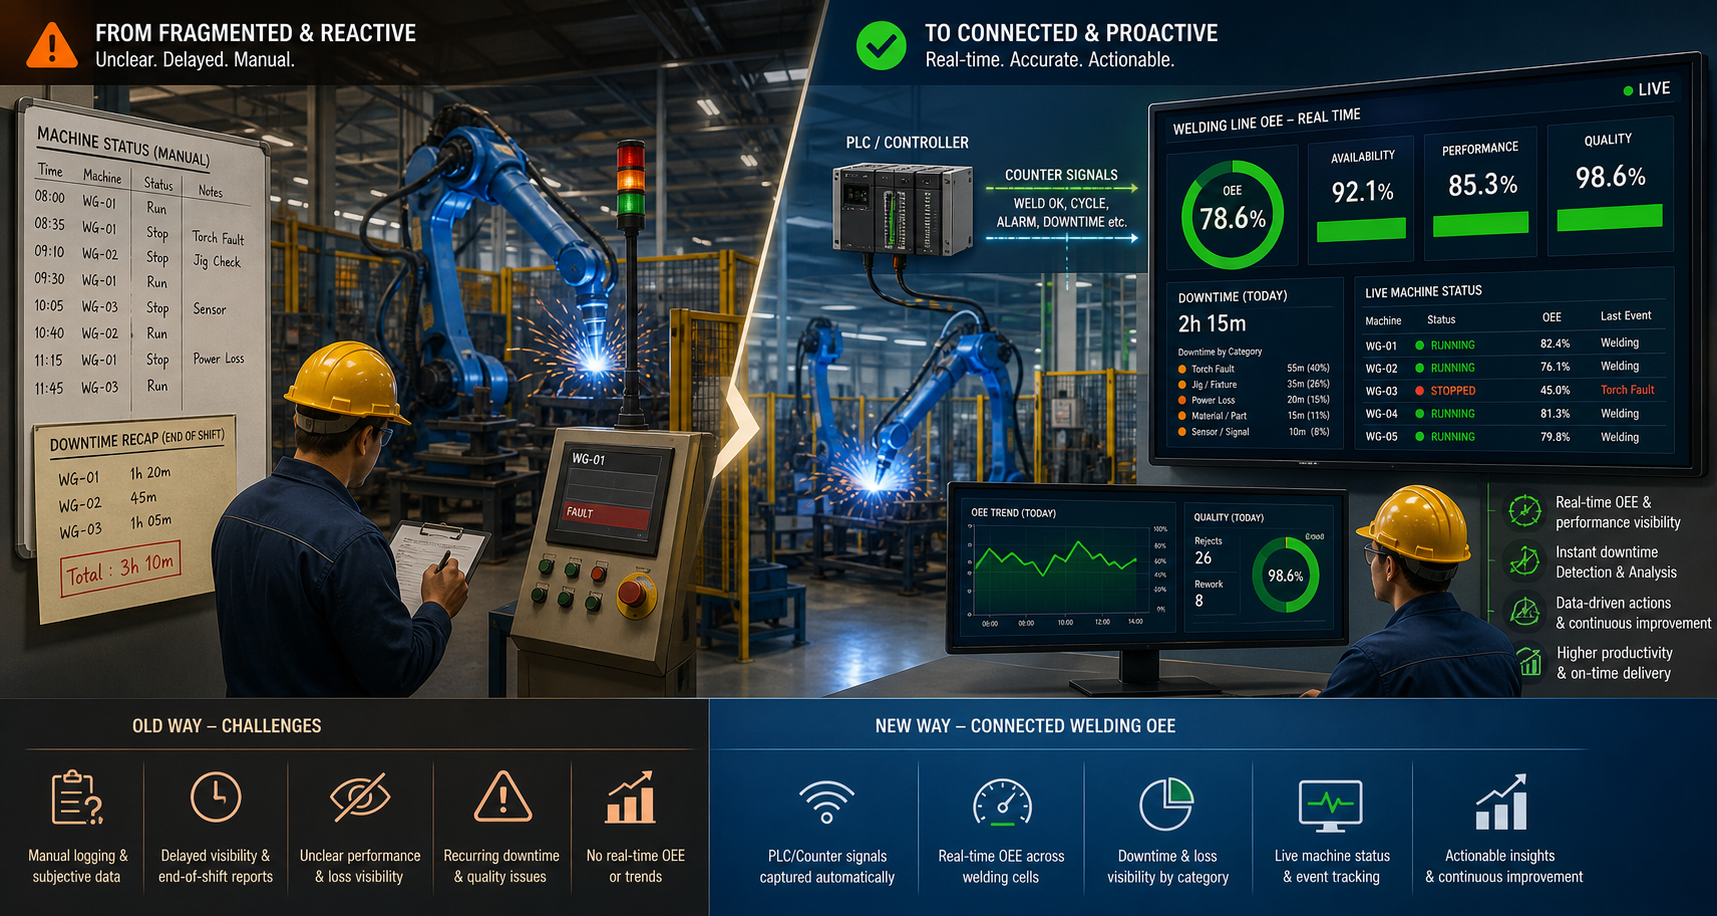
This flow moves welding monitoring away from end-of-shift notes and reactive recap into live OEE visibility. Machine events, counter signals, and downtime categories are surfaced in one operational view so engineering and production teams can act on availability, performance, quality, and loss patterns while the line is still running.
PLC, OPC UA, and Andon Flow
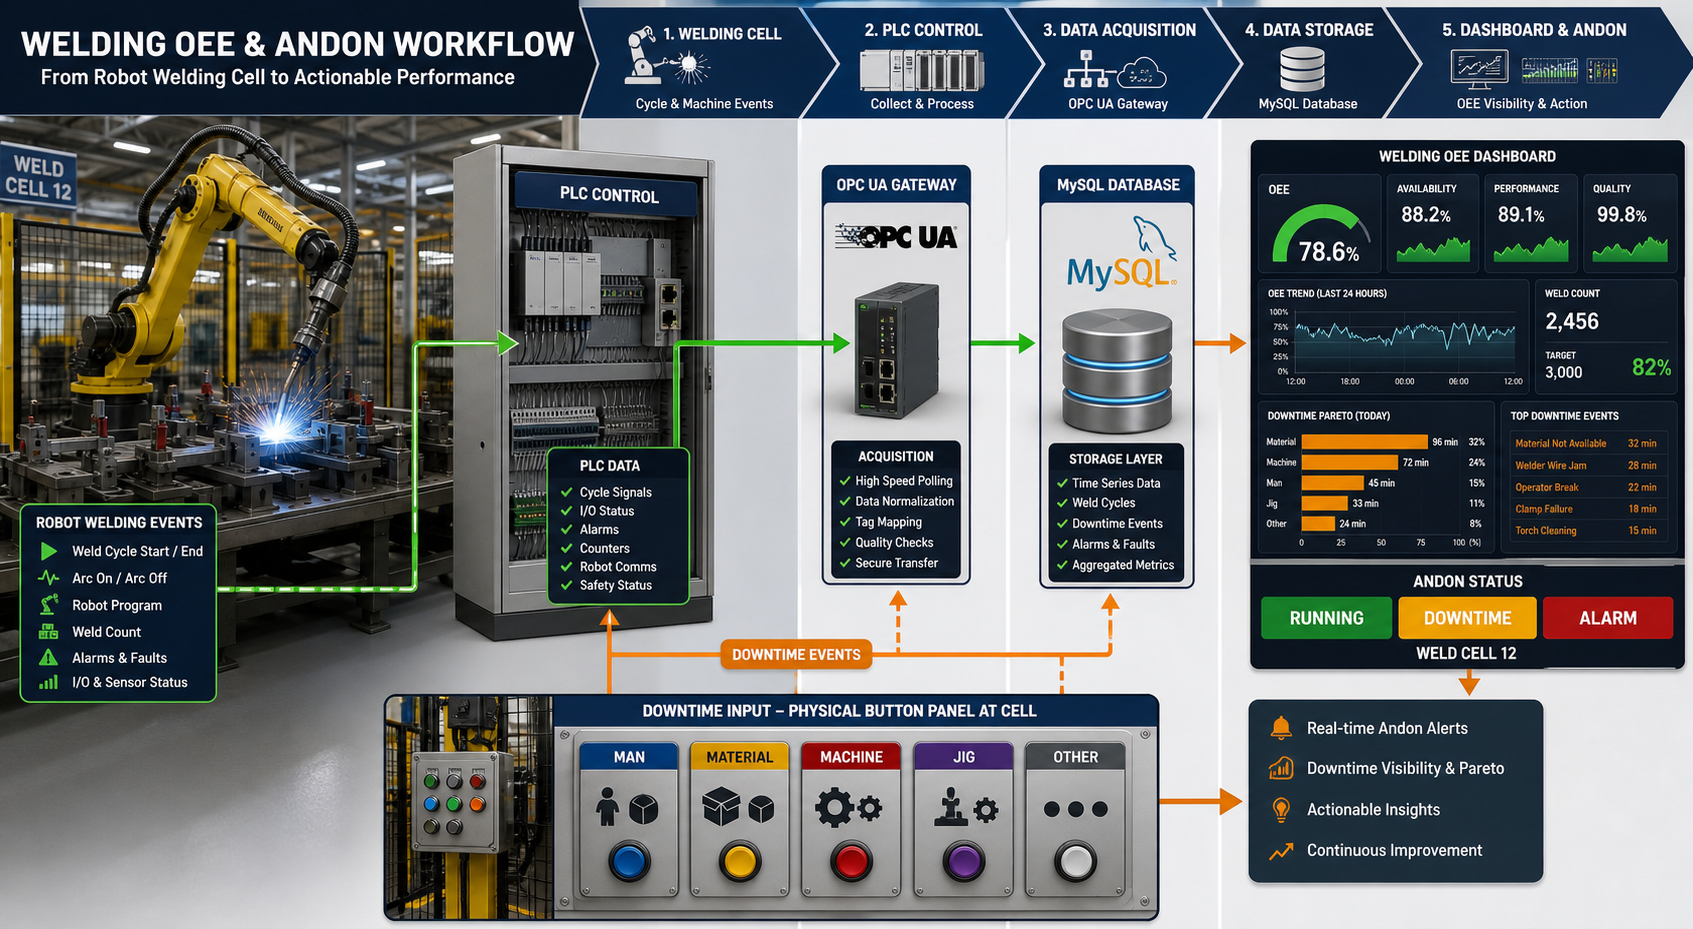
The operational path starts at the welding robot cell, where cycle events, counters, alarms, and machine signals are collected by PLC control. Data acquisition then moves through the OPC UA layer into MySQL for time-series, weld cycle, and downtime storage. At the same time, downtime input can be triggered directly from the physical button panel at the cell using the categories man, material, machine, jig, and other, so OEE and andon dashboards can read one consistent production and loss dataset.
Business Problem
Machine-level effectiveness and loss patterns are harder to evaluate when welding status, downtime, and output signals are reviewed late or captured across fragmented logs.
My Contribution
Built the interface and monitoring flow for surfacing OEE metrics, downtime visibility, machine status, and performance context in a more usable real-time production view.
Operational Flow
- PLC and controller signals capture robot cycle, run-stop condition, weld count, alarms, and related events from the welding cell.
- OPC UA data acquisition maps those signals into MySQL so production, event, and downtime records can be stored in one operational layer.
- Downtime can be entered from the physical cell button panel with categories man, material, machine, jig, and other.
- Output and downtime data are translated into availability, performance, quality, and andon visibility on the dashboard.
- Live dashboards and trend views support faster response before losses accumulate further.
Key Capabilities
- Real-time OEE monitoring for welding production.
- PLC and OPC UA based data acquisition into MySQL.
- Downtime and loss visibility by event category.
- Andon downtime capture from physical cell buttons.
- Machine status boards and trend-oriented analytics.
- Operator and engineering-friendly monitoring interface.
Tech Stack
PHP, MySQL, Chart.js, Tailwind CSS, IoT Gateway OPC UA, PLC Omron.
Current Status
Status: Internal monitoring workflow with emphasis on real-time visibility, downtime detection, and machine-level analytics for welding operations.
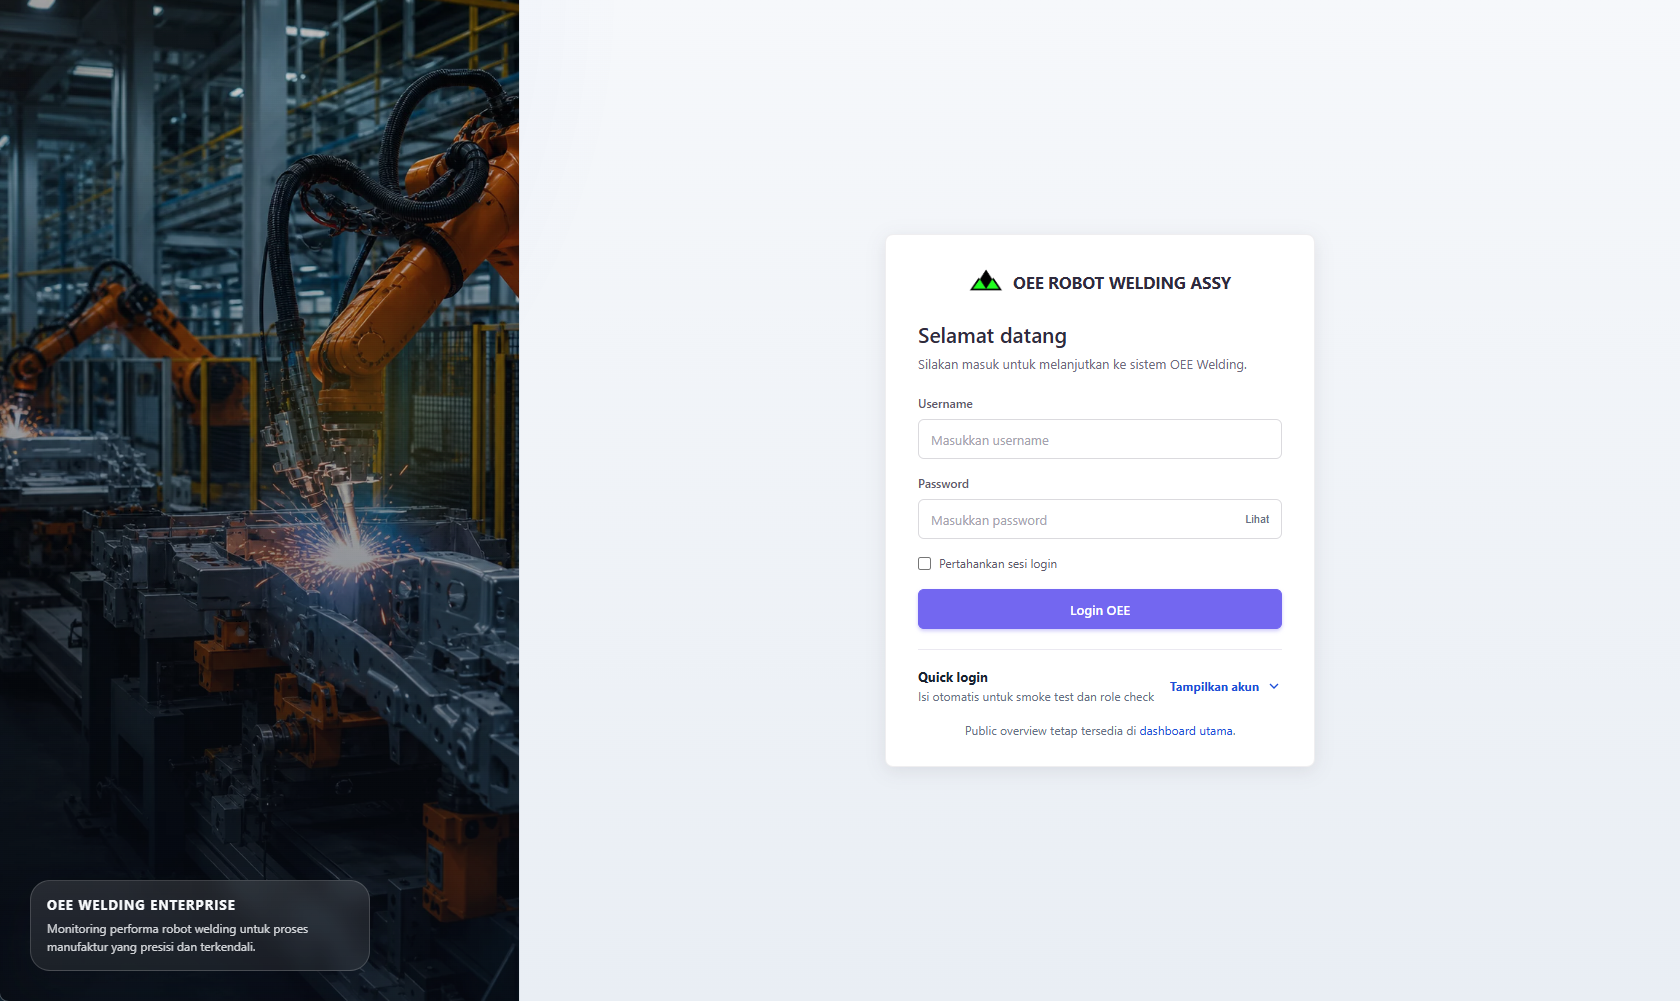
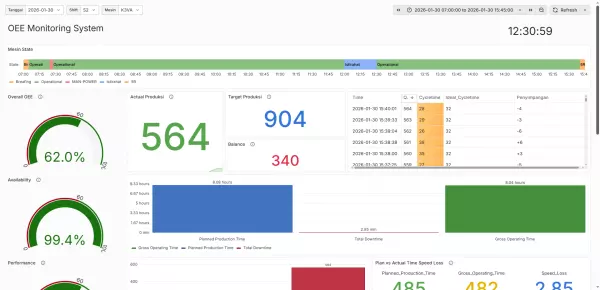
Portfolio-safe manufacturing monitoring media.